


Income Inequality & Economic Growth, Part 2
Taming the Complexity

The safest road to Hell is the gradual one — the gentle slope, soft underfoot, without sudden turnings, without milestones, without signposts.
~C.S. Lewis

In Part 1, I summarized some forces at play between social inequity and economic growth. There are many interactions to consider, but in this post I make a case that the upshot is relatively — but not stupidly — simple.
Bottom line first: In the short-term (six months to three years), there is a trade-off. Growth gets better as income inequality gets worse. Or growth takes a dip as income inequality gets temporarily better. In the medium-term (about three to twenty years), inequity hurts growth. Eventually, in the long-term, inequity breaks societies in which case macroeconomic debates become academic.
Figure 1 shows income inequality and economic growth in the U.S. covering about a hundred years. I measure income inequality as the ratio of total pre-tax income for the top 10% of earners to the total pre-tax income for the bottom 50% of earners and refer to it as “Top 10/Bot 50.”
For starters, note the plunge in income inequality after World War II. Then, beginning in the mid-1970s, income inequality climbs to Depression-era levels over the subsequent forty years. (My next post will explain how I think this happened.) The reduction in income inequality around 2020 and 2021 is probably just a short-term effect associated with the COVID pandemic-induced fluctuations in growth. But we will see…
Growth rate in Figure 1 is measured as percent changes year-to-year in gross domestic product (GDP) per capita, adjusted for inflation (“real”). Growth data is available for 1948 and later. The dotted trend line is a best-fit second-order polynomial. It shows growth trending downward over the last forty years. That the growth trend has drooped over the same forty years as income inequality has risen is, I believe, no coincidence.
The Short Term
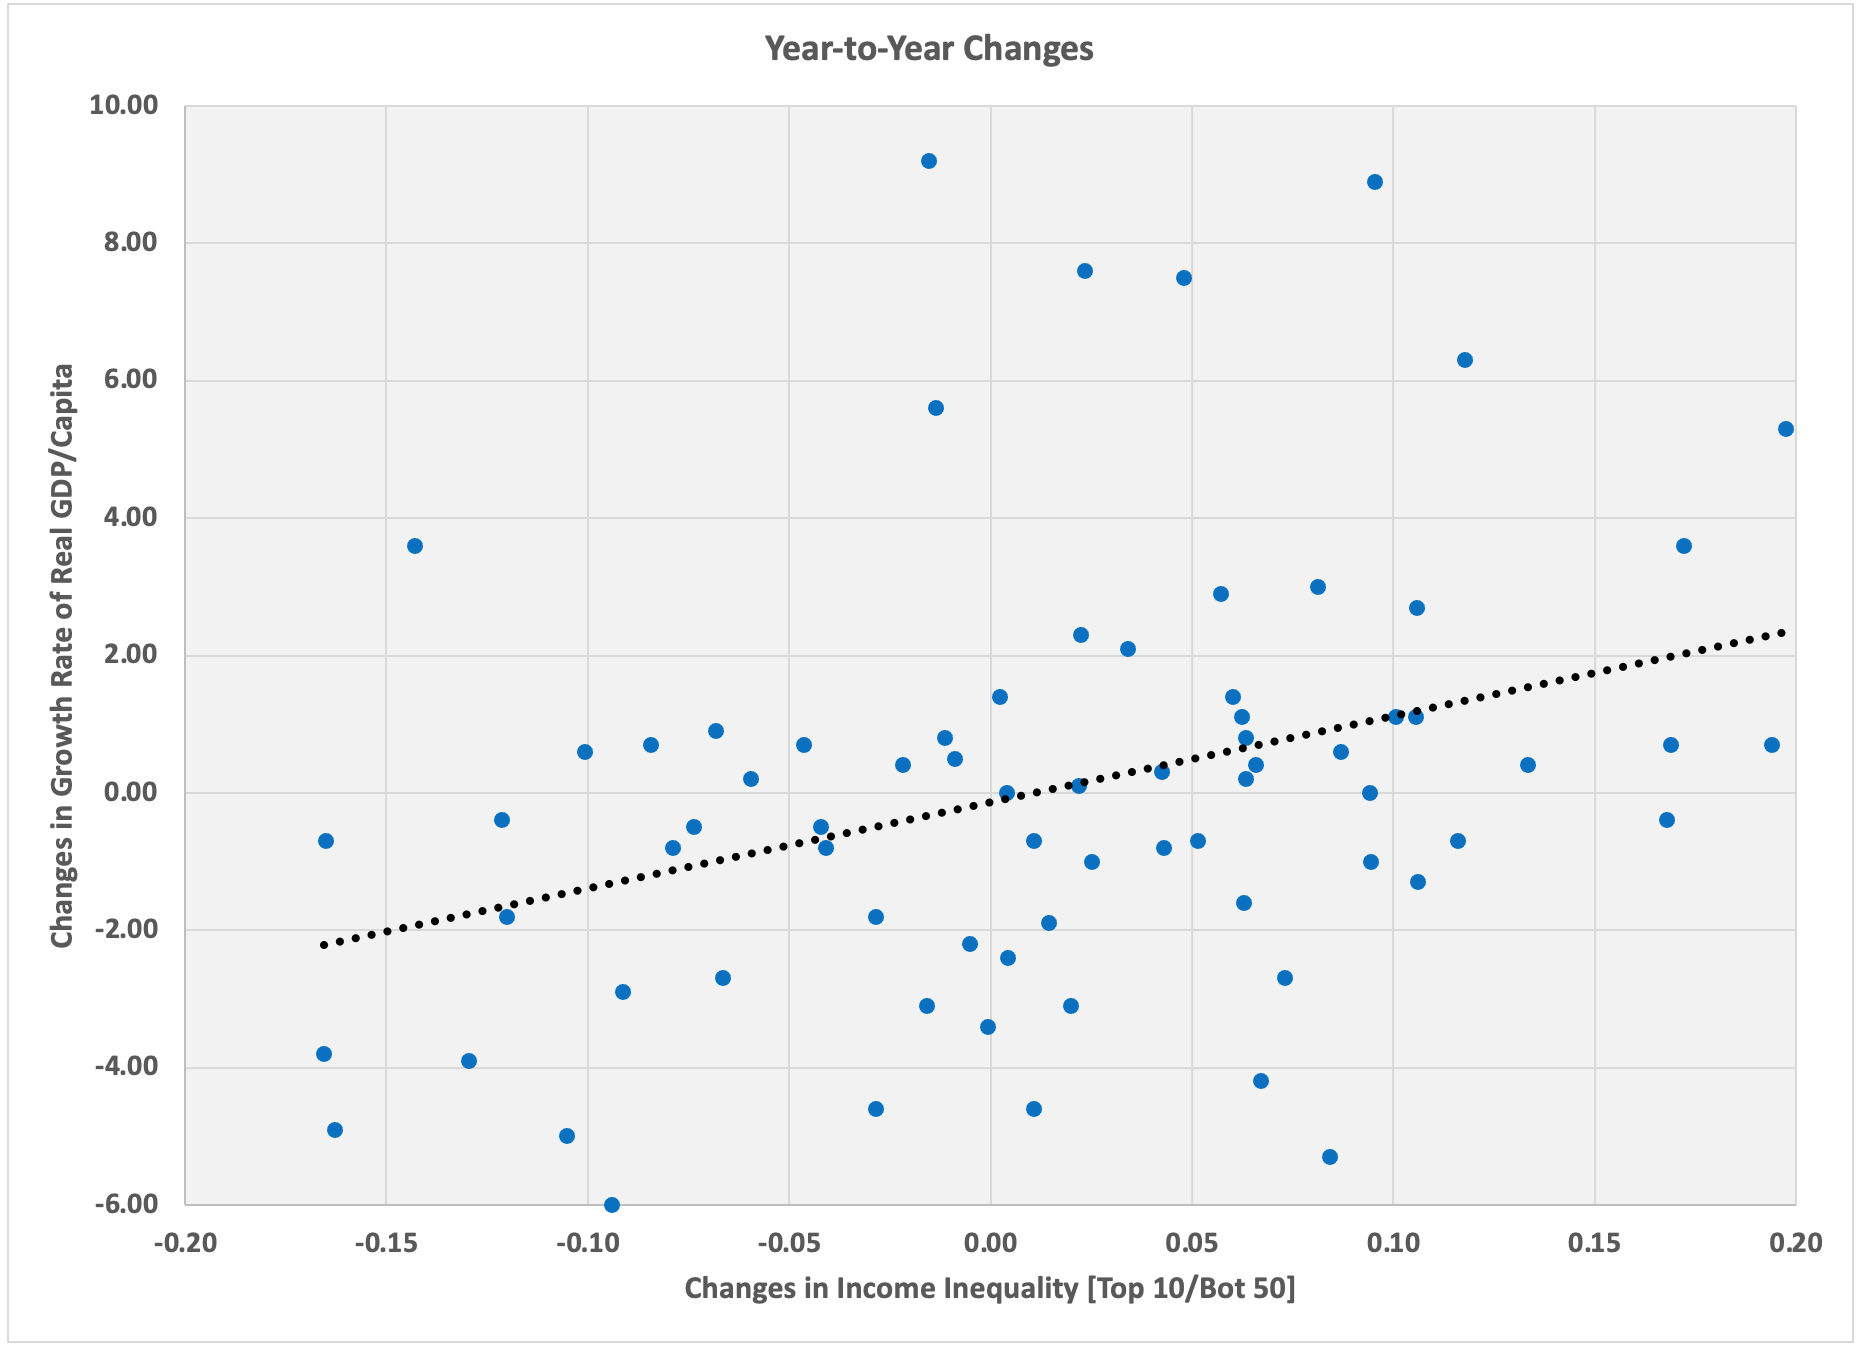
Figure 2 shows how year-to-year changes in growth and income inequality tend to move together. In the short term, when one gets a touch better, the other tends to get a touch worse. As explained in Part 1, this is because of the way the Fed’s monetary policy interacts with citizens’ expectations for future interest rates, inflation, and unemployment.
The Long Term
The nature of capitalism spurs growth and increases income inequality. Without policy specifically designed to reduce inequity, if history is any indication, extreme social unrest will eventually lead to revolution, war, or collapse, all of which are bad, I assume, for economic growth.
The Medium Term

In three to twenty years — what I am calling the medium term — elevated income inequality hurts growth. Even if income inequality did not directly hurt growth in the medium term, it would still be a problem because a) it definitely hurts in the long term and b) unchecked income inequality causes more income inequality, accelerating the journey towards the long-term consequences.
But even before catastrophe arrives, income inequality hurts growth through mechanisms described in Part 1: Social unrest creates economic friction. The interplay of high-skill and low-skill labor contributes to rising income inequality. Our tendency to spend more in response to increases in others’ incomes hurts savings, thus investment, thus future growth. Poor market regulation leads to short-sighted financial decisions which hurt future growth. A dearth of investment in human capital increases inequity and hurts future growth. Money (which comes from the wealthy) in politics engenders self-dealing and corruption, which lead to flagging trust in our institutions, hurting growth.
Figure 3 shows that 20-year growth has drooped as 20-year-average income inequality has increased. In the graph, it appears things start going south in 1990, but the data points in Figure 3 are 20-year averages, so things actually got off-track in the 1970s (see Figure 1). In 1970, a recession (triggered by an OPEC oil shock) combined with especially poor monetary policy kicked off a twenty-year bout of high inflation and four recessions in quick succession.
In 1979, Paul Volcker was appointed as Fed chairman by President Jimmy Carter; Volcker is credited by economists with taming “stagflation,” a combination of high inflation and high unemployment, neither of which is good for growth. The fix took time — five years to get inflation and unemployment back to reasonable levels and an additional nine years before the Fed’s policy interest rate was near its target.
Meanwhile, beginning in 1978, financial market deregulations transferred more wealth to the wealthy and more risk to the poor and middle class. Interacting with Reagan’s tax cuts for high income earners, this contributed to a sharp increase in income inequality beginning in 1980. Since then, income inequality and economic growth have both trended worse.
In a Nutshell
The natural long-term tendency in a healthy economy with trustworthy institutions is steady growth as long as income inequality is kept in check. In the short term, stable growth is the role of monetary policy — it’s the Fed’s job. But note that short-term instability has long-term consequences. (If you stumble on a crack in the sidewalk but don’t fall, that is short-term stability; if you trip, fall down, and break a wrist, your short-term instability has long-term consequences.)
Since monetary policy is silent on income inequality — and more broadly, inequity — medium- to long-term economic health relies on social and fiscal policy. To offset the natural tendency of income inequality to worsen, which hurts growth, we should: invest in human capital as it develops in children; reduce money in politics; regulate financial markets with an eye towards reducing risk for the middle class; reinvest in equal-access infrastructure (most importantly, a clean reliable energy infrastructure); and put a damper on intergenerational wealth accumulation.
Next up: How did we get here?