


Look How Happy We Are, Though
Comparing OECD countries.

To pay attention, this is our endless and proper work. ~Mary Oliver
The truth will set you free, but first it will piss you off. ~Gloria Steinem

A marketing expert might advise against publishing this post — it’s kinda negative. But it is also factual. In this case, I prefer to look at stuff I don’t want to see until the urge to look away has passed.
If you stick it out, the glimmer of hope I hinted at here gets more attention at the end of this post.
There Is Despair…
Judging from OECD literacy and health comparisons in my previous post, plus the fact that literacy and health are tightly correlated with deaths of despair in the U.S., one might expect that our mental health is comparatively poor among OECD countries. Unfortunately, that is indeed true, as shown above. Our suicide rate is 35th highest out of 38 OECD countries. As for drug deaths, we are in our own morbid category, twice as bad as the second-to-last on the list, Estonia. Canada ranks third-to-last, and we are three times worse than that. Our rate of drug deaths is over eight times the average of all other OECD countries.
Again, our rate of drug deaths is over eight times the average of all other OECD countries. WTF? This is not an issue separate from economic success, folks. An economy is only as good as quality of life in the society it supports.
…But They Say We Are Number Four…
U.S. News has a Best Countries list (of course). Their 2022 list has the U.S. at #4. Switzerland, Germany, and Canada beat us out. But based on what criteria? Maybe it’s stuff we don’t care about? Maybe we’re Number One in terms of stuff we do care about in the U.S.? Let’s take a closer look…
They used 73 criteria divided into 10 “subrankings.” Then they did a global survey. U.S. News asked their 17,000 respondents whether they attributed each subranking to a given country. So a given country’s ranking is based on average subjective perceptions held by people who mostly don’t live there.
There is another problem, too: Subrankings were weighted according to how strongly they correlated to GDP. The subrankings with the strongest weightings were Quality of Life, Entrepreneurship, Agility (described as “adaptable, dynamic, modern, progressive, responsive”), and Social Purpose (concerned with things like human rights, environment, and social justice).
The Quality of Life subranking asks whether each country has “a good job market, affordable, economically stable, family friendly, income equality, politically stable, safe, well-developed public education system, [and] well-developed public health system.” If we could be great at this definition for Quality of Life, even if it came at the cost of, say, Agility, wouldn’t we do it? But U.S. News counts Quality of Life as less than 15% of their overall country-ranking score. Not only that, it is quality of life as perceived on average by people who mostly live somewhere else.
Isn’t quality of life as directly experienced by citizens of a nation the entire point, though? Am I missing something here? In my view, metrics like GDP and global perceptions of “agility” matter only to the extent that they improve quality of life.
In U.S. News’s Quality of Life subranking — disregarding the other, arbitrary subrankings along with their correlations to GDP — the U.S. ranks 21st behind much of Europe, the U.K., Canada, and New Zealand…for whatever the average perceptions of non-U.S.-residents about U.S. quality of life is worth (not nothing, to be sure, but maybe not a lot).
A much more thoughtful approach is taken by the authors of the World Happiness Report.
…But, No, Middle of the Pack Is More Accurate.
A quick note on sources: My graphs and commentary in this post are based on the 2022 World Happiness Report. There is now a 2023 version, but the story it tells isn’t different enough to warrant a new round of data wrangling on my part.
The World Happiness Report (WHR), like the flawed U.S. News report, relies on surveys. However, the WHR researchers asked (way more) people about their own experiences. The top-line WHR results are based on respondents’ answer to the question, essentially, On a scale of 0 to 10, how is your life? Additionally, the WHR shows results for six factors they believe to be contributors to happiness. The factors are GDP per capita (yes, income matters some), social support, freedom to make life choices, perceptions of corruption, healthy life expectancy, and generosity.
Crucially, the six factors are not weighted and summed to formulate an overall happiness result. Instead, the overall happiness result and each of the six factors are direct survey results — they are raw data. The WHR authors do estimate the impact of each of the six factors on overall happiness, but because they already know the top-line result, they simply did the math to find the explanatory power of each factor. This is essentially the reverse of U.S. News’s approach.
Bottom line: We’re Number Sixteen.
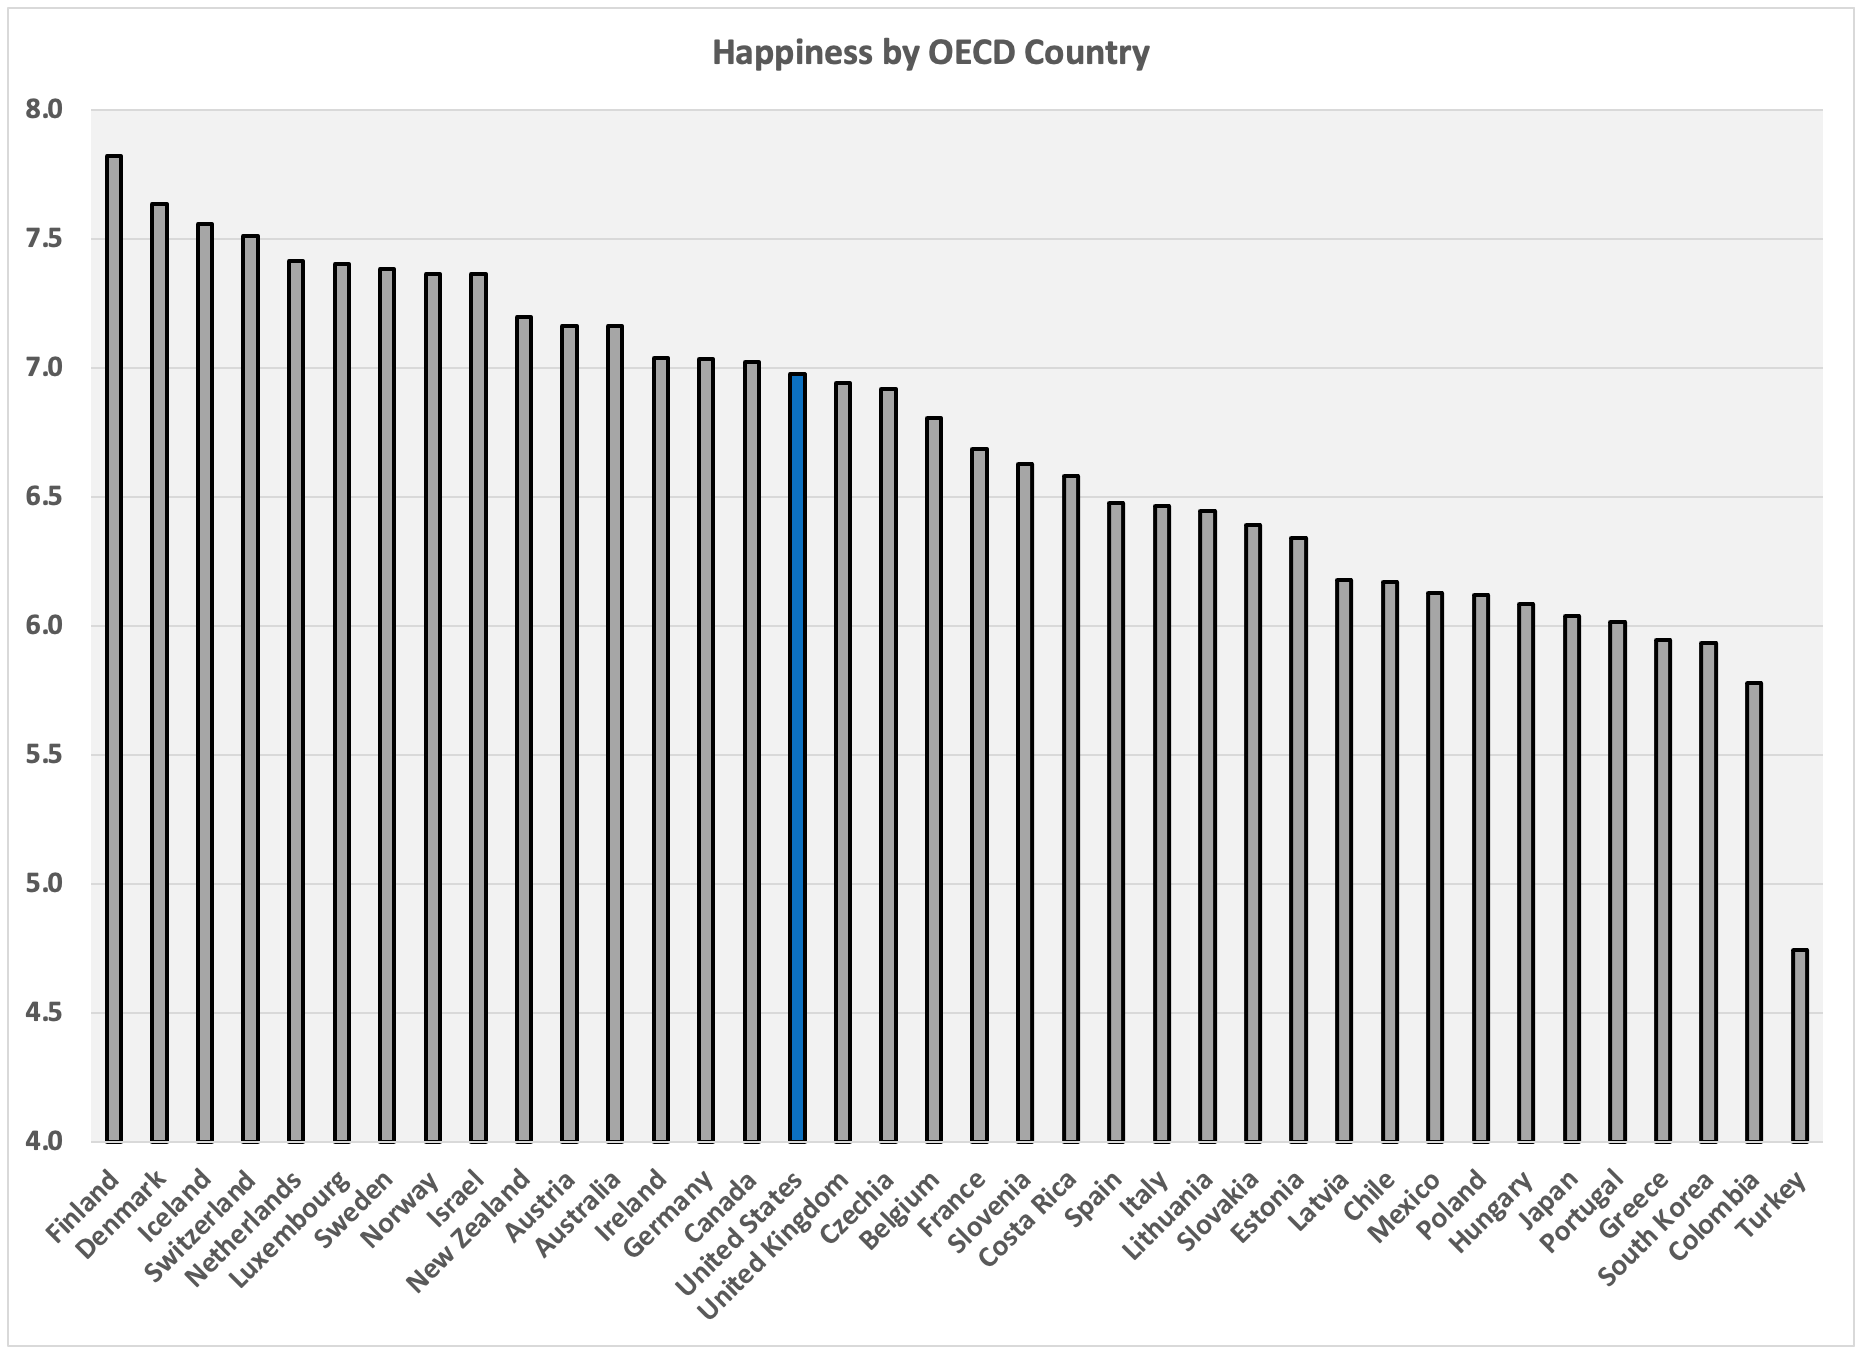
At first, there may appear to be good news in this graph. Given a deep level of despair in the U.S. (see top graph), to rank 16th happiest among OECD countries, we must be doing something to offset the despair. But here is another way to say the same thing: Many U.S. citizens are in deep despair while many others are ostensibly quite happy with their lives.
OK, so what are we good at? GDP per capita, for one thing. In GDP, the U.S. is Number Five. Our GDP helps, then, but there are five other factors that also matter.
The level of “social support,” which the WHR defines as a country’s average (yes = 1, no = 0) response to the survey question, “If you were in trouble, do you have relatives or friends you can count on to help you whenever you need them, or not?” (Note that this is not social policy — it’s a question of culture.) The U.S. is below average among OECD countries at 21st.
We do a touch worse (22nd) in terms of “Freedom to make life choices.” This is another national average of another binary survey question: “Are you satisfied or dissatisfied with your freedom to choose what you do with your life?”
To arrive at “Perceptions of corruption,” the WHR uses two binary questions, the answers to which are averaged. “Is corruption widespread throughout the government in this country or not?” and “Is corruption widespread within businesses in this country or not?” We rank 20th in this respect, again solidly “meh.”
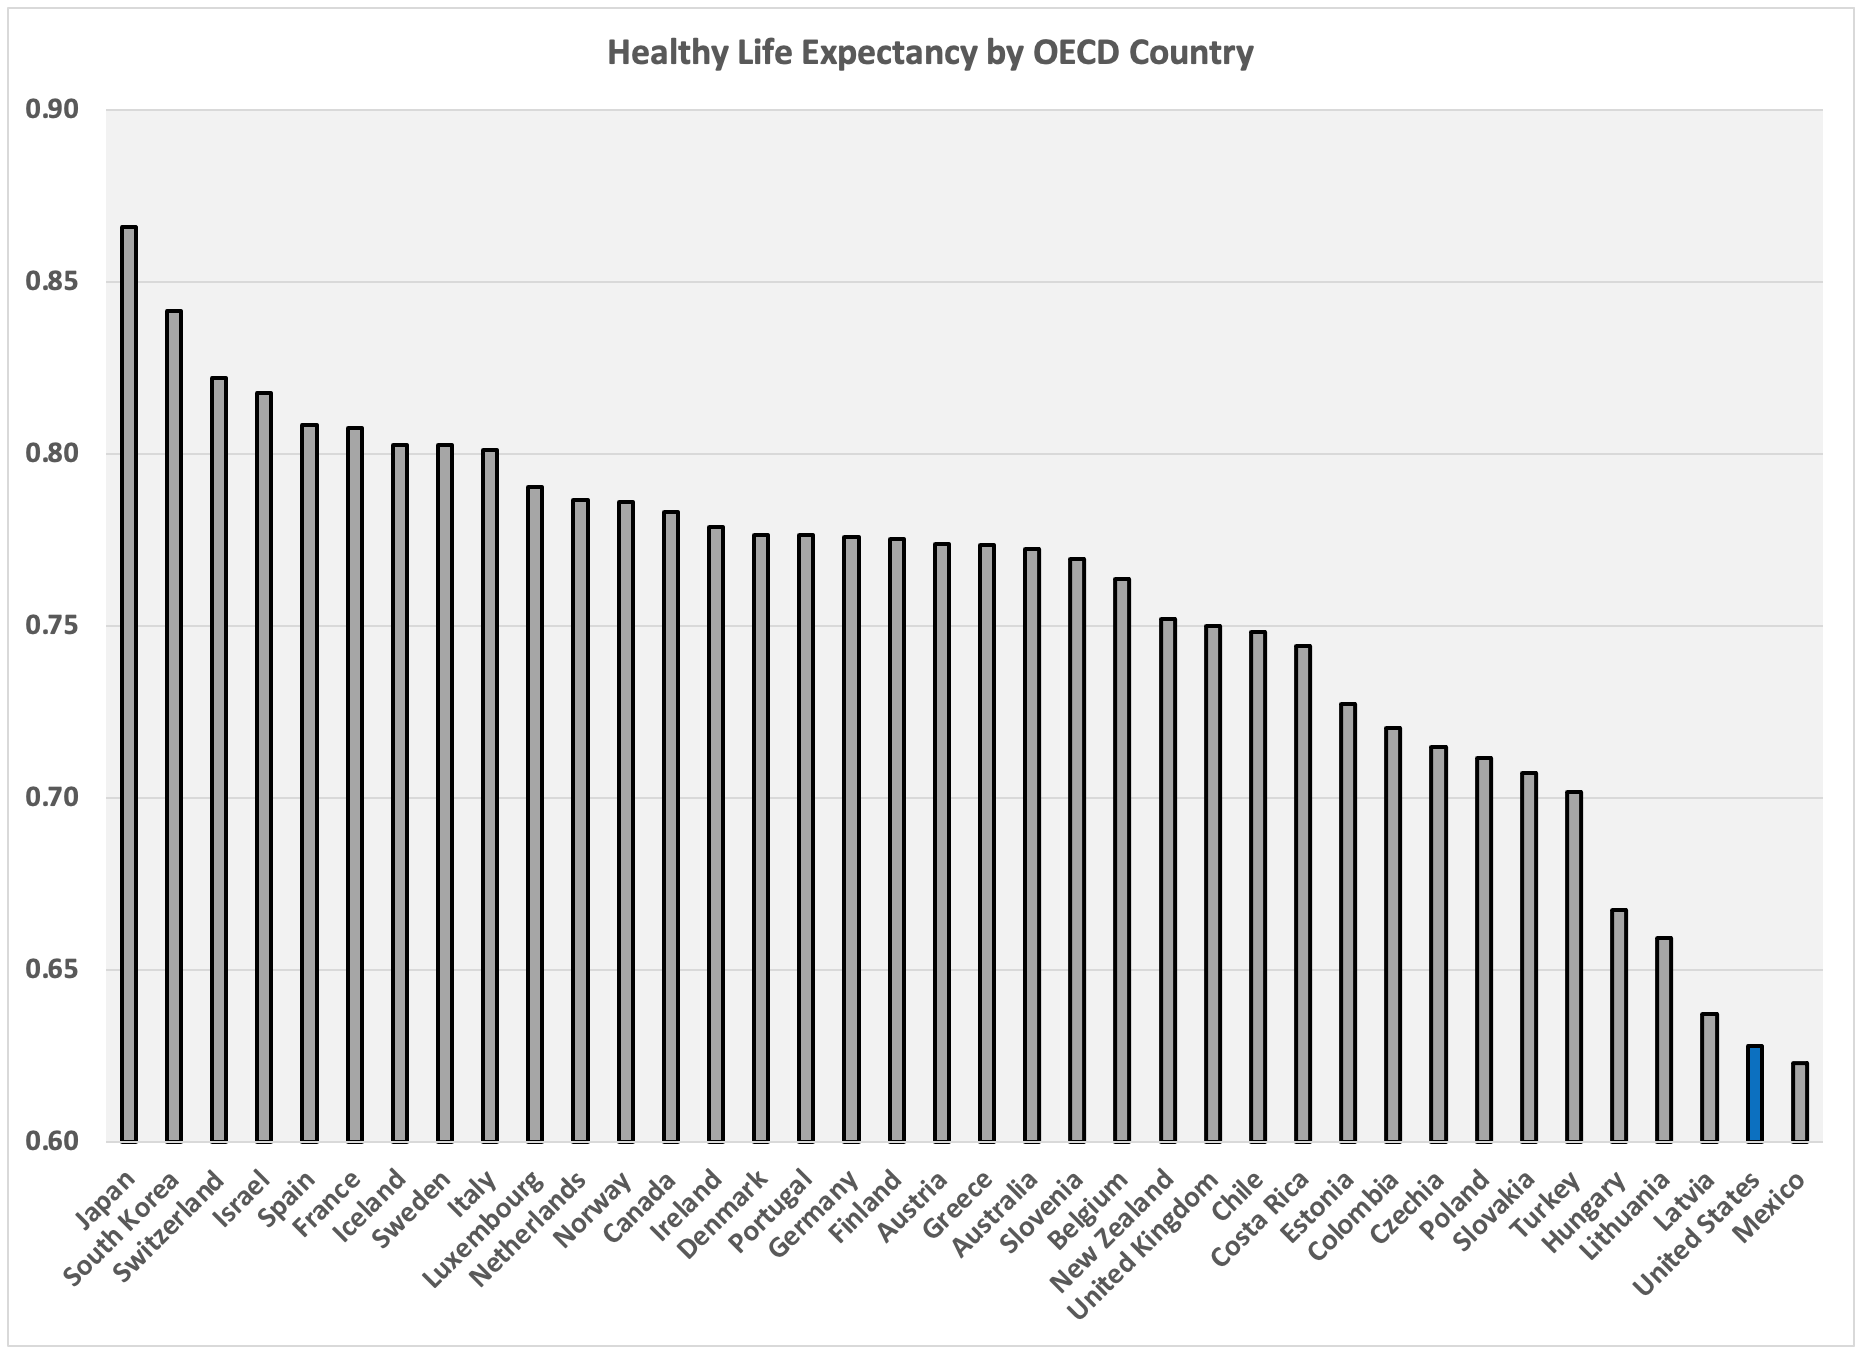
Of the four factors pulling down our overall happiness assessment, “Healthy life expectancy” is by far the worst. First, note that it is “Healthy life expectancy,” not “life expectancy.” We come in 37th out of 38.
Finally, the Glimmer of Hope
We are more generous on average than most countries. Generosity is the average of responses to the question, “Have you donated money to a charity in the past month?” Among OECD countries, we are 6th.

According to the WHR, then, we are reasonably good at two things: income and generosity. Can we parlay these bright spots into a bigger win? After all, they ought to be complementary.
Next up: A deeper dive on generosity.
Last comment… I’ve always been curious if our generosity is high because our social services are low. Maybe other countries don’t need so many nonprofits to do the work because their government does it? Their taxes are higher to pay for those services so they are all paying for the social services.
“ An economy is only as good as quality of life in the society it supports.”
This is it.