


What the Math Says: Inequity & Income Inequality
Two-thirds of income variation is associated with inequity.

Mathematics is not about numbers, equations, computations, or algorithms: it is about understanding.
~William Thurston, “Mathematicians: An Outer View of the Inner World”

Which Causes What?
“Correlation is not causation.” Yes, and…if there are reasons to believe that causation is mutual and reinforcing — more A leads to more B, which simultaneously causes more A and so on — then correlation quantifies the causal loop. In these situations, we should not dismiss correlation. Furthermore, arguments about whether A causes B or B causes A are not helpful. It’s not so much that both arguments are right; it’s more like both arguments are wrong. In practice, arguing that A causes B often implies a belief that B does not cause A; likewise for the position that B causes A. Both positions can’t be right, because then they would both be wrong.
If you take the position that inequity is an outcome of income inequality, then you might argue “inequity” is not, in fact, inequitable. You might argue that people with the skills and ambition to earn more income have consequently earned better amenities — better neighborhoods, bigger homes, better food, faster internet service, less pollution. You might lump children’s education and health care in with these amenities. After all, if you can afford to give your kids a leg up, then of course you would do it. One implication of this position is that “unequalness” results from a fair competition. In other words, inequity does not cause income inequality.
If, on the other hand, you take the position that inequity causes income inequality, then you might argue people who earn higher incomes are doing so at the expense of the innocent. If you believe inequity is the reason for income inequality, you would have to believe that high income earners are taking advantage. They must be selfish or worse. You might have some character judgment about the wealthy.
There Will Be Minor Discomfort
I have come to believe the uncomfortable truth is a) some income inequality is due to differences in work ethic, intellect, and character, and b) some inequity is due to what Pulitzer Prize-winning sociologist Matthew Desmond refers to as “unrelenting exploitation.”
The question I aim to answer in this post is, “How much?”. Bottom line first: Over seventy percent of county-to-county variations in median household income are predicted by variations in three metrics I use as proxies for inequity — literacy rate, life expectancy, and infant mortality. In other words, more than two-thirds of income inequality is due to circumstances of birth.
For at least twenty percent of children, learning to read well is more about customized training than about intelligence. See Calvin’s story here. Literacy is an equity issue because a) customized training is more expensive than teaching to a classroom full of students with different strengths, and b) school budgets are tied to neighborhood wealth.
Infant mortality data captures the fact that parents' health care impacts their children’s health and the health of the adults those children become. More generally, it is an outcome of health care access, parents’ wealth, and systemic racism.
The average person's health care over time drives life expectancy. Health care is comprised of both self-care and the care one receives from the health care system. Self-care quality follows from one’s expectations for the future (see The Disparity of Despair). Expectations, in turn, are linked to education quality and the socio-economic status of the parents.
Health care is an equity issue because socio-economic status, most notably the socio-economic status into which one is born, drives its quality.
If you accept literacy, life expectancy, and infant mortality as metrics about circumstances into which one is born — therefore not metrics about work ethic, intellect, or character — then you have to accept that less than one-third of variations in median income is due to work ethic, intellect, and character. To put a finer point on it, if you are wealthy in the U.S., you deserve some of the credit, but probably not as much as your birth circumstances — specifically, education quality, health care quality, and family wealth.
For those who want the math, read on. For those who don’t, skip to the Summary.
Regression Model
I ran Ordinary Least Squares (OLS) regressions using the following interaction model.
The dependent variable is logarithm of county-level median household income. Independent variables are literacy rate, life expectancy at birth, and infant mortality rate, all at the county level. The interactions are between a single education-quality metric (literacy rate) and two health care-quality metrics (life expectancy and infant mortality).
Data
Literacy data is from the National Center for Education Statistics. For a visual, see my post, The U.S. Illiteracy Spiral. Income, life expectancy, and infant mortality data is from the University of Wisconsin Population Health Institute. A graph showing both is available in my Life and Death and Income post.
Results
A table of regression results are shown below, with the preferred model highlighted in blue.
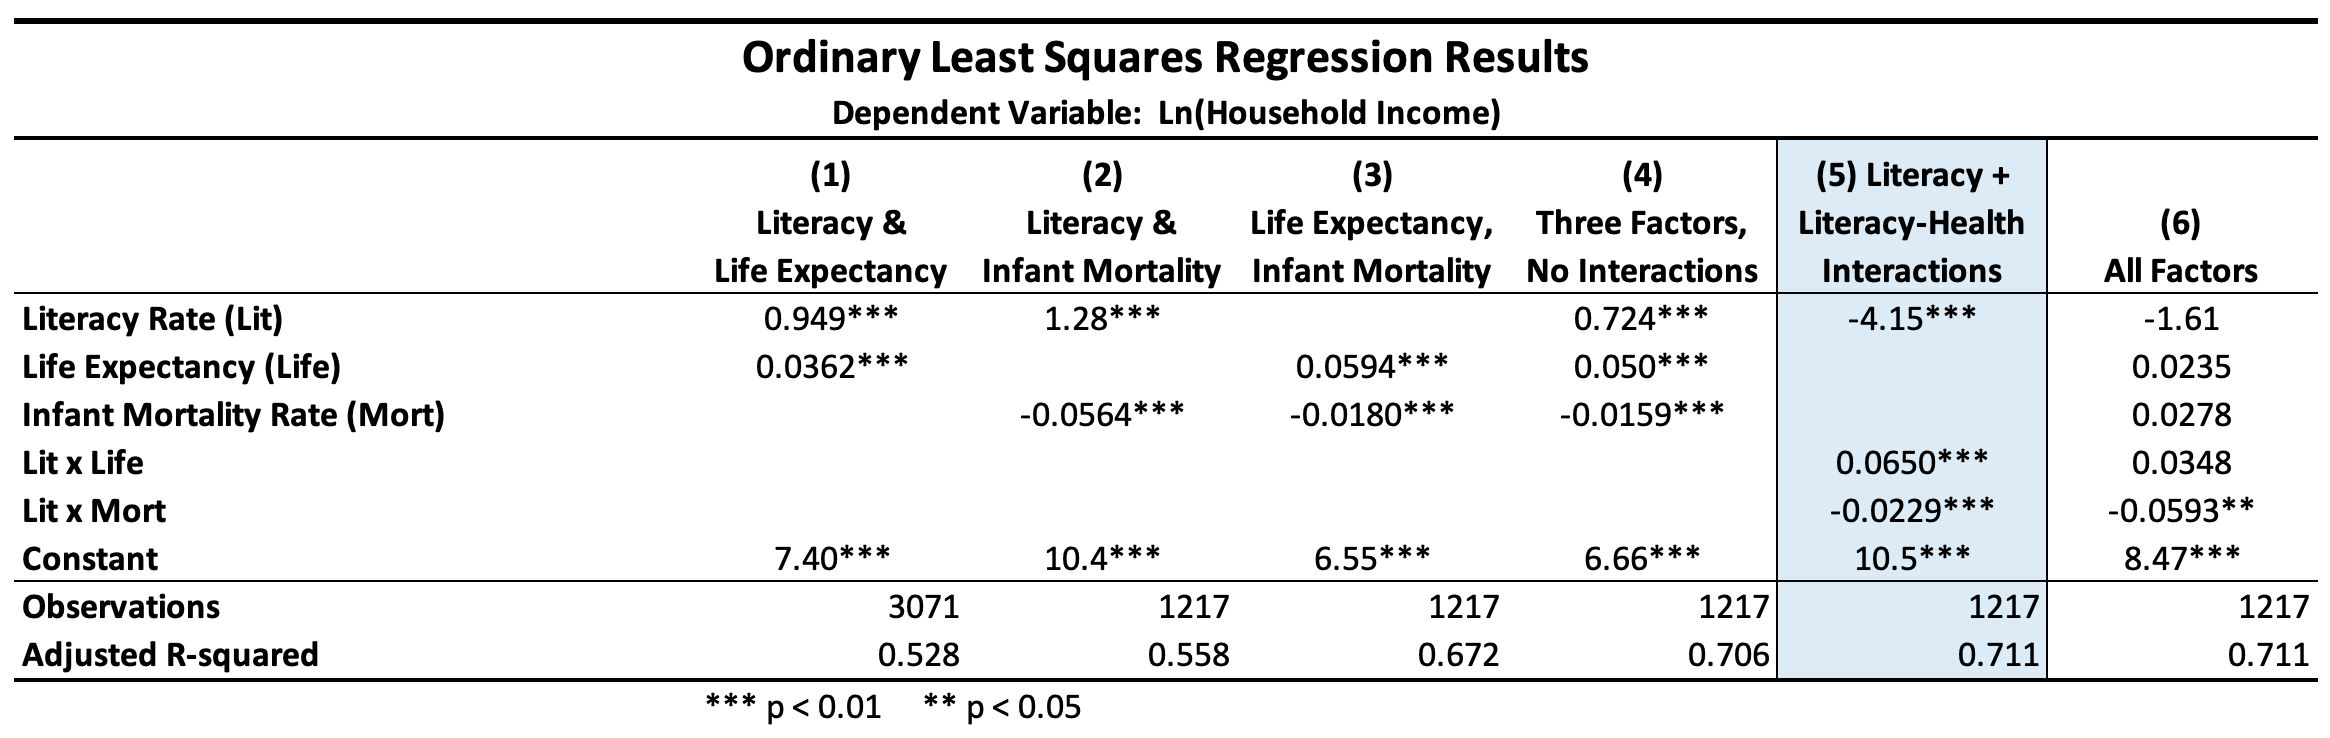
Columns 1, 2, and 3, vis-à-vis column 4, verify that each of the three inequity metrics adds explanatory value — the inclusion of each metric increases adjusted R-squared while maintaining coefficients highly significantly different from zero. Note this is true for infant mortality even though its inclusion reduces the number of observations by roughly 60%. Column 4 shows results for the non-interactive model.
The regression results shown in Column 6 include coefficients for all six terms. The loss of significance for almost all coefficients makes it apparent that co-linearity is present. With Column 5, the explanatory power of Column 6 is maintained while eliminating the co-linearity problem. Thus, Column 5 represents the preferred model, in which the health care metrics interact with the education metric.
Summary
Invoking the quotation at the top of this post, the numbers, equations, and computations are behind us. And what do we now understand? My big takeaway is that human capital investments in children and their families — specifically in education and health care — are investments in our national economy. More than that, these are investments in the “American way,” putting money where our mouths are when our mouths utter things like, “…all [people] are created equal…” The math suggests investments in human capital are worthy of dedicated focus.
Next up: In terms of education and health care metrics, how do we compare to other rich countries? (Brace yourselves.)